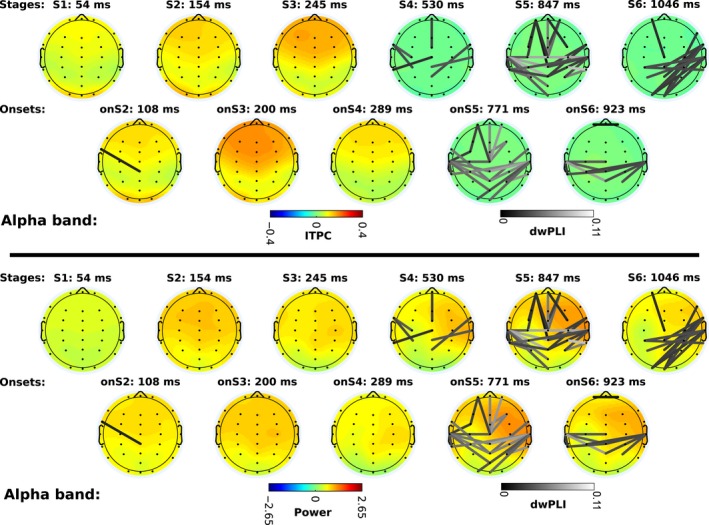
Figure 6.

Alpha band power, phase locking (ITPC: intertrial phase clustering), and phase connectivity (dwPLI: de‐biased weighted phase‐lag index). Scalp maps and connectivity follow the same distribution as Fig. 5. To aid visual comparison, power, ITPC, and dwPLI scales are consistent in all scalps on Figs 5 and 6.
