
Figure 3.
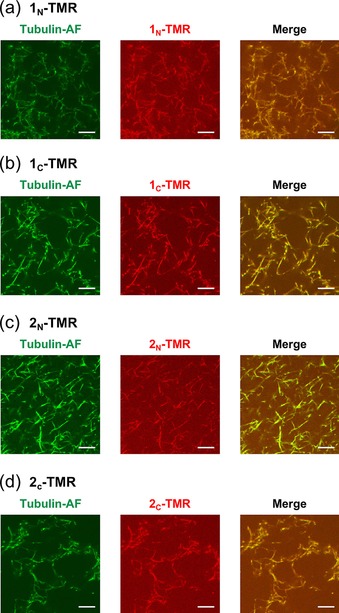
Confocal laser scanning microscopy (CLSM) images of microtubules incubated with: a) 1N‐TMR, b) 1C‐TMR, c) 2N‐TMR, and d) 2C‐TMR by the “Before” method (scale bar: 10 μm). Final concentrations: [Tubulin]=[Tubulin‐AF]=2 μm, [1N‐TMR]=[1C‐TMR]=[2N‐TMR]=[2C‐TMR]=7.5 μm, and [GMPCPP]=20 μm.