
Figure 4.
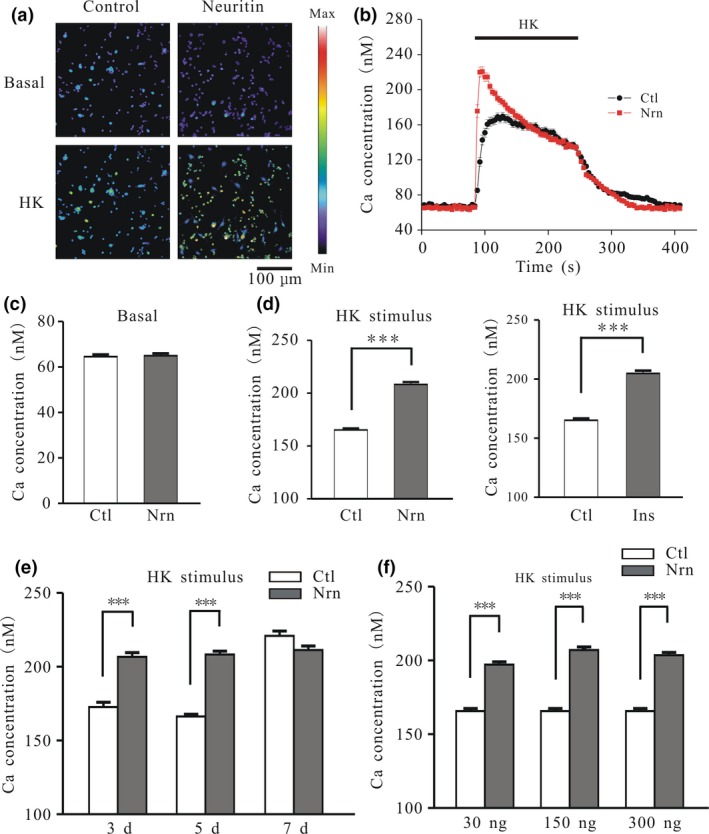
Neuritin and insulin increase Ca2+ influx induced by high potassium (HK) depolarization in a time‐dependent manner. (a) Effects of neuritin on [Ca2+]i before (basal) and after high potassium (K+) (HK) depolarization. Changes in Fura‐2 AM fluorescence excitation ratios with increasing [Ca2+]i are represented as a color change from purple to red. (b) Changes in [Ca2+]i upon application of a depolarizing HK solution in the absence or presence of neuritin. (c) Quantitative analysis of the effects of neuritin on basal [Ca2+]i (Ctl, n = 137; Nrn, n = 121). (d) Quantitative analysis of [Ca2+]i induced by HK in the absence or presence of neuritin and insulin (Ctl, n = 120; Nrn, n = 120; Ins, n = 82). (e) Comparison of the effects of neuritin on [Ca2+]i induced by HK after different lengths of time in culture (days) (3 days Ctl, n = 79; 3 days Nrn, n = 97; 5 days Ctl, n = 128; 5 days Nrn, n = 120; 7 days Ctl, n = 48; 7 days Nrn, n = 54). (f) Effects of neuritin concentration on [Ca2+]i induced by HK (Ctl, n = 116; 30 ng/mL Nrn, n = 109; 150 ng/mL Nrn, n = 124; 300 ng/mL Nrn, n = 125). Data represent mean ± SEM, n indicates the number of cells. ***p < 0.001 between groups connected with a straight line (unpaired t test or one‐way anova followed by Bonferroni post hoc test).