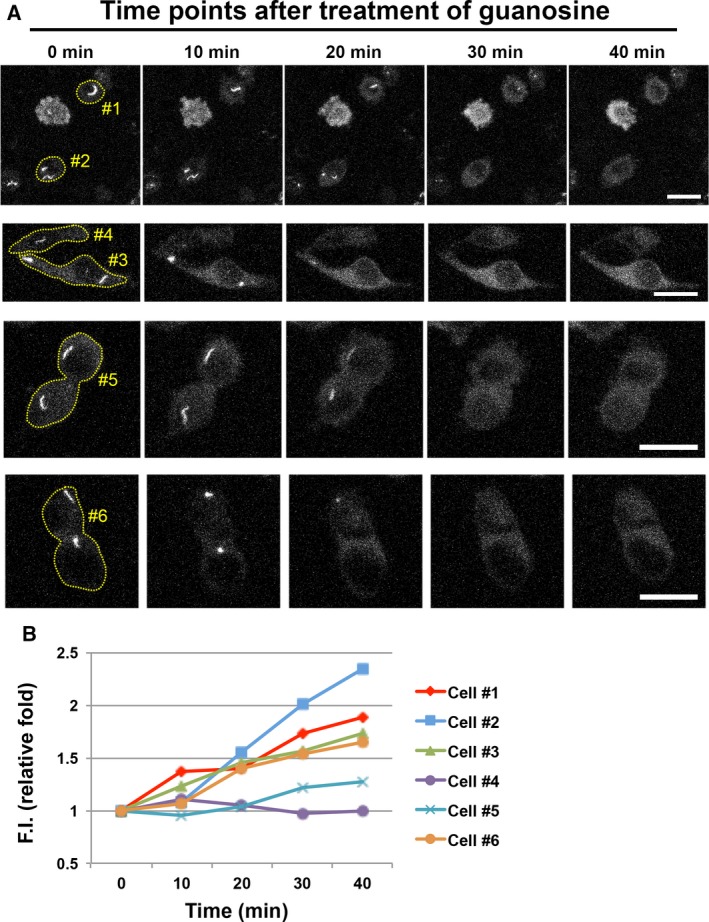
Figure 8.

Quantification of fluorescence intensity of OFP‐IMPDH2‐expressing cells during cytoophidium disassembly. OFP‐IMPDH2‐expressing HeLa cells were treated with MPA (100 μm) for 6 h before live‐cell imaging to induce large IMPDH cytoophidia. Images were captured every 10 min upon supplementation of guanosine (1 mm) with the same setting of confocal microscope. Time‐laps images of each cell samples for analysis were shown in (A). (B) Quantification of fluorescence intensity (F.I.) of corresponding samples shown in (A). F.I. of the cell indicates the total intensity of the cell minus the intensity of the region of the cytoophidium. Scale bars = 20 μm.
