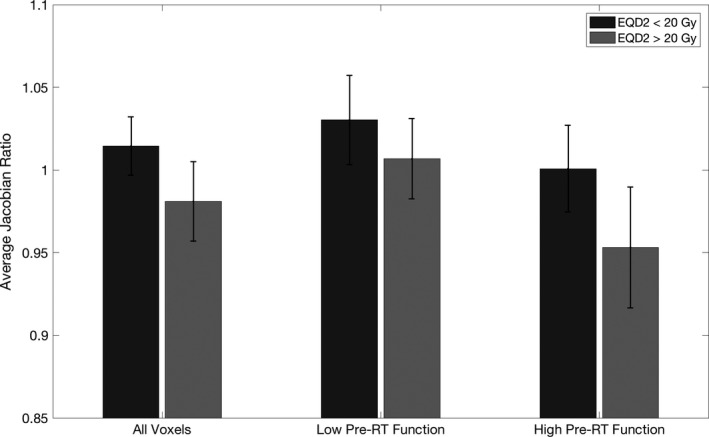
Figure 3.

Bar plot of the average Jpost RT /pre RT across subjects for voxels receiving <20 Gy and >20 Gy for all voxels, voxels with low pre‐RT function, and voxels with high pre‐RT function. Error bars represent one standard deviation above and below the mean across subjects.
