Figure 3.

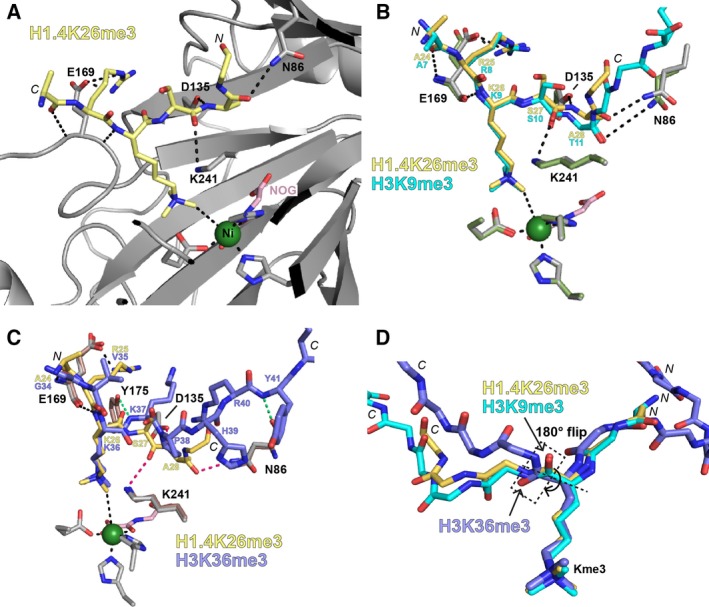
Binding mode of H1.4K26me3 to KDM4A. The figure shows views from (A) an X‐ray crystal structure of KDM4A bound to nickel (green, substitute for iron), NOG (pink, a 2OG mimetic inhibitor) and an H1.4(18–32)K26me3 peptide (yellow), alone, or overlaid with: (B) a structure of KDM4A bound to H3(7–14)K9me3 peptide (cyan, PDB ID http://www.rcsb.org/pdb/search/structidSearch.do?structureId=2OQ6) 26, and (C) a structure of KDM4A bound to an H3K36me3 peptide (violet, PDB ID http://www.rcsb.org/pdb/search/structidSearch.do?structureId=2P5B) 47. Residues from KDM4A in the H1.4K26 structure are shown as pale grey sticks, those from KDM4A in the H3K9 structure are shown as pale green sticks and those from KDM4A in the H3K36 structure are shown as pale pink (A–C). Some of the key interactions between KDM4A and the H1.4K26me3 peptide are shown by black dashes. Interactions between the H1.4K26me3 peptide and KDM4A conserved in the H3K9me3 peptide structure, but not in the H3K36me3 peptide structure are marked as pink dashes. Interactions only observed in the H3K36me3 peptide structure are shown as green dashes. (D) Overlay of the peptide backbones (and Kme3 side chain) of each peptide. The amide flip between the H3K36 peptide, and the H3K9 and H1.4K26 peptides, is highlighted with a dashed black box.
