
Figure 1.
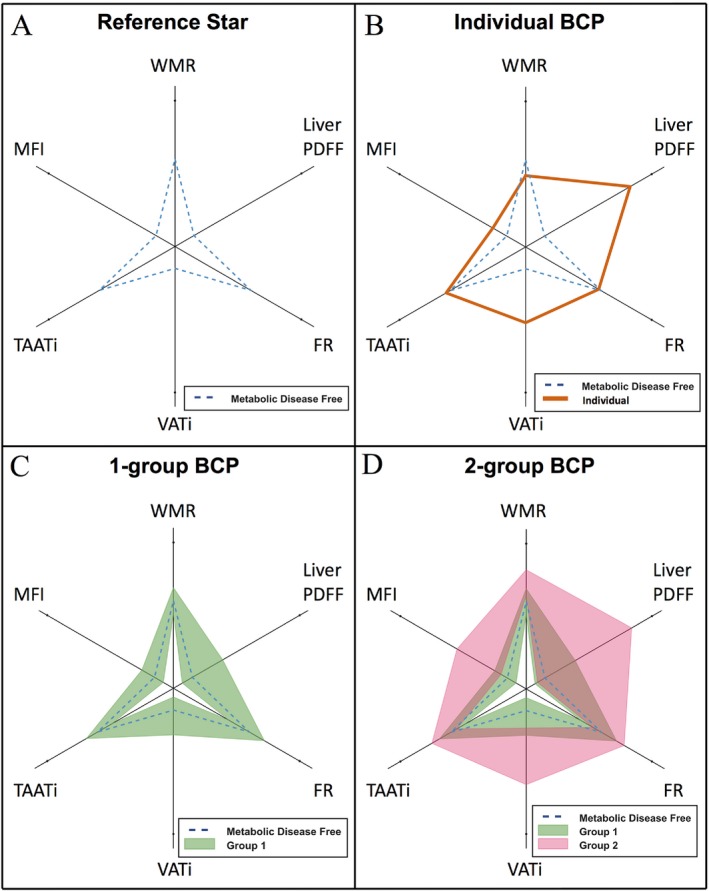
Visualization examples of the body composition profile (BCP). (A) Median of a metabolic disease‐free (MDF) population (same in B‐D); (B) an individual BCP (orange); (C) a group visualized as the field spanning the interquartile range (green); (D) two groups visualized as fields spanning their interquartile ranges (green and pink); brown areas represent the overlap between groups. FR, fat ratio; MFI, muscle fat infiltration; PDFF, proton density fat fraction; TAATi, total abdominal adipose tissue index; VATi, visceral adipose tissue index; WMR, weight‐to‐muscle ratio. [Color figure can be viewed at http://wileyonlinelibrary.com]