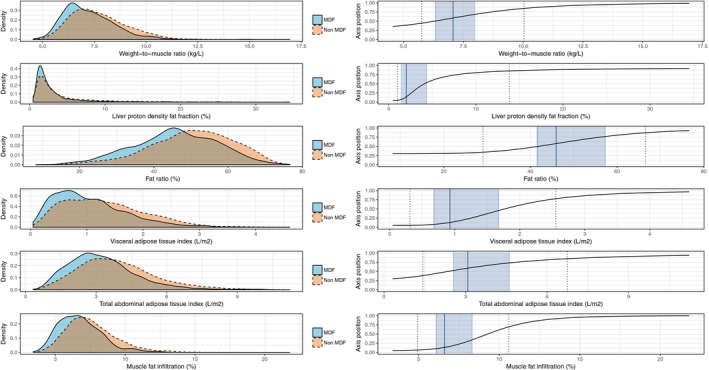
Figure 2.

Density and scaling of BCP variables. Left panels are the density plots for each BCP variable comparing MDF subjects (solid contour) with those not characterized as MDF (dashed contour); right panels are the transfer functions from BCP variable values to their position on corresponding axes in the BCP plot, including median values (solid line) and the interquartile ranges (shaded areas) of the MDF group as reference and the 5th and 95th percentile of the whole cohort (dashed lines). BCP, body composition profile; MDF, metabolic disease free. [Color figure can be viewed at http://wileyonlinelibrary.com]
