
Figure 4.
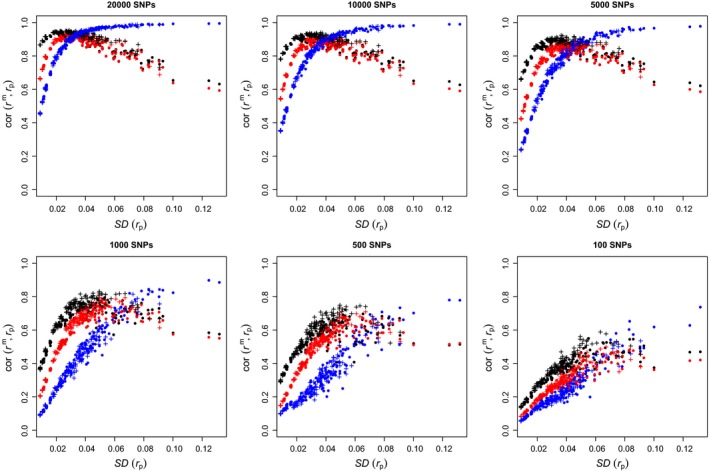
Correlations between marker‐ and pedigree‐based kinship, against the standard deviation of pedigree‐based kinship with different numbers of SNPs. Each point corresponds to one of 300 simulated pedigrees. Symbols and colours as in Figure3 [Colour figure can be viewed at http://wileyonlinelibrary.com]