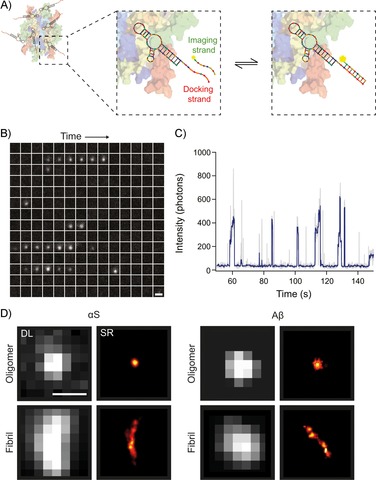
Figure 1.

The concept of ADPAINT. A) Schematic representation of ADPAINT showing an aggregate bound by multiple aptamers. The DNA docking strand on the aptamer is transiently bound by the complementary imaging strand to generate a SR image. B) Example time montage of an oligomer undergoing ADPAINT. Each sub‐image is separated by 0.5 s, moving through time from left to right then top to bottom; scale bar: 1 μm. C) Intensity profile of the oligomer in (B). Each intensity burst represents the binding of the imaging strand to the aptamer. Grey: raw intensity profile, blue: using a Chung–Kennedy filter31 with a window of five frames applied. D) Examples of diffraction‐limited (DL, using thioflavin‐T) and super‐resolved (using ADPAINT) images of an αS and Aβ oligomer and fibril. Scale bar: 500 nm.
