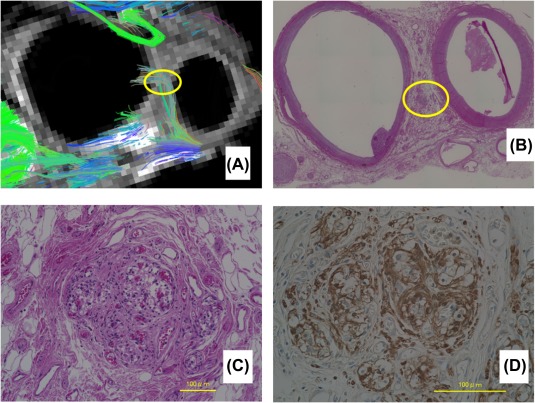
Figure 6.

A, The axial slice of the MRI at the level near the bifurcation. Multiple fibers are seen to run towards the bifurcation (yellow circle). B, Hematoxylin‐eosin staining of the same specimen with a low power field. C, Hematoxylin‐eosin staining. The high power field of the yellow circle in B showing structures similar to the carotid body. D, The S‐100 immunostaining. High power field. Same slice of figure C [Color figure can be viewed at http://wileyonlinelibrary.com]
