Figure 6.

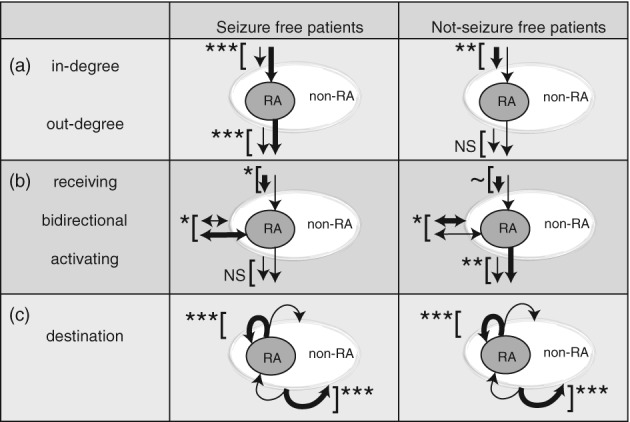
Summary of findings. (a) In‐degree and out‐degree in seizure‐free and not seizure‐free patients: The in‐degree was increased (displayed with a thick arrow toward the RA) in RA‐nodes compared to non‐RA nodes (displayed with a thin arrow toward the non‐RA) in seizure‐free patients. The opposite was found when comparing RA‐nodes with non‐RA nodes in not seizure‐free patients. The out‐degree was increased (displayed with a thick arrow originating from the RA) in RA‐nodes compared to non‐RA nodes (displayed with a thin arrow originating from the non‐RA) in seizure‐free patients. No difference in out‐degree was observed in not seizure‐free patients. (b) The directionality of connections in seizure‐free and not seizure‐free patients: The percentage of receiving connections (arrows toward the (non‐)RA‐areas) was decreased in RA‐nodes compared to non‐RA‐nodes in both seizure‐free and not seizure‐free patients. The percentage of bidirectional connections (arrows on both sides) was increased in the RA‐nodes compared to non‐RA nodes in seizure‐free patients. The opposite was found in not seizure‐free patients. The percentage of activating connections (arrows pointing from the [non‐RA]‐areas) was increased in RA‐nodes in not seizure‐free patients. No difference in percentage of activating connections was observed in seizure‐free patients. (c) The destination of connections from the RA or non‐RA nodes: In both seizure free and not seizure‐free patients, the ratio of connections from RA to RA‐nodes and non‐RA to non‐RA nodes was higher, suggesting an isolated epileptogenic area. NS = not significant, ~ = p < .1, * = p < .05, ** = p < .01, *** = p < .001
