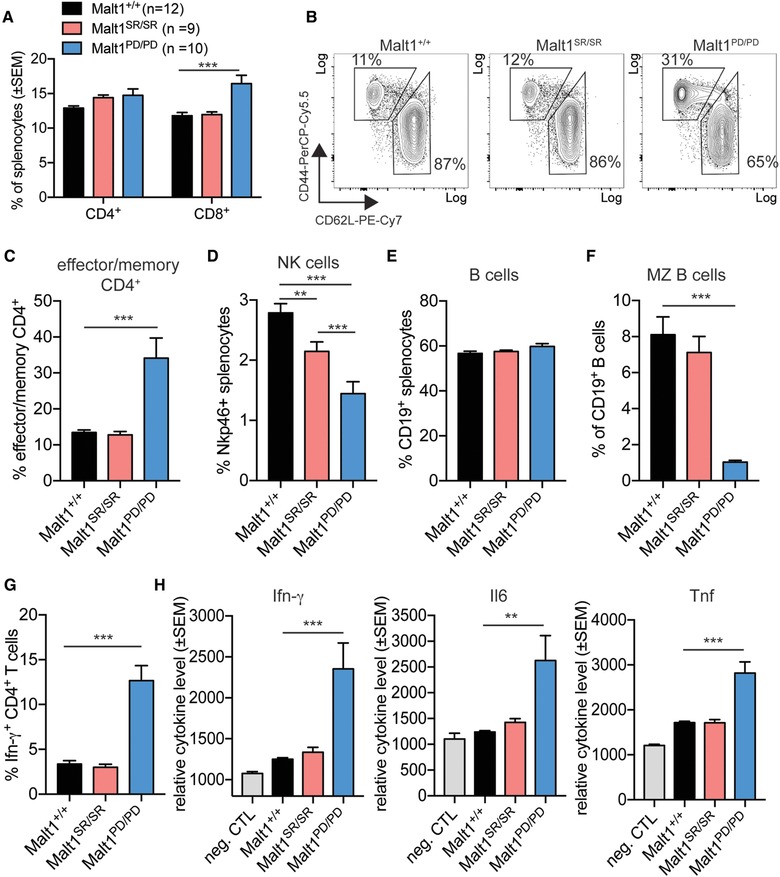
Figure 2.

Malt1 self‐cleavage resistance rescues mice from T cell‐mediated autoimmunity (A) Frequency of CD4+ and CD8+ T cells within the spleen of Malt1+/+ (n = 12), Malt1SR/SR (n = 9) and Malt1PD/PD (n = 10) mice was analyzed by flow cytometry. (B) Representative flow cytometry data and (C) frequency of CD4+ T cells with an activated/memory (CD44hi, CD62Llo) or naïve (CD44lo, CD62Lhi) phenotype. (D) Frequency of Nkp46+ NK cells and (E) CD19 + B cells of total splenocytes. (F) Frequency of marginal zone (MZ) B cells, as identified by CD23 and CD21 expression within the total B cell population. (G) Frequency of Ifn‐γ ‐positive CD4 + T cell within the splenocyte population. (H) Ifn‐γ, Il6 and Tnf cytokine concentration was measured in the serum of mice of the different cohorts by cytometric bead array. Assay buffer was used as background fluorescence negative control to assess relative serum concentrations (neg. CTL). Data are shown as mean + SD and are representative of three independent experiments with four mice per experiment. Student's t test was used for statistical analysis. Sample means were considered significantly different at p < 0.05, with *p < 0.05, **p < 0.01 and ***p < 0.001.
