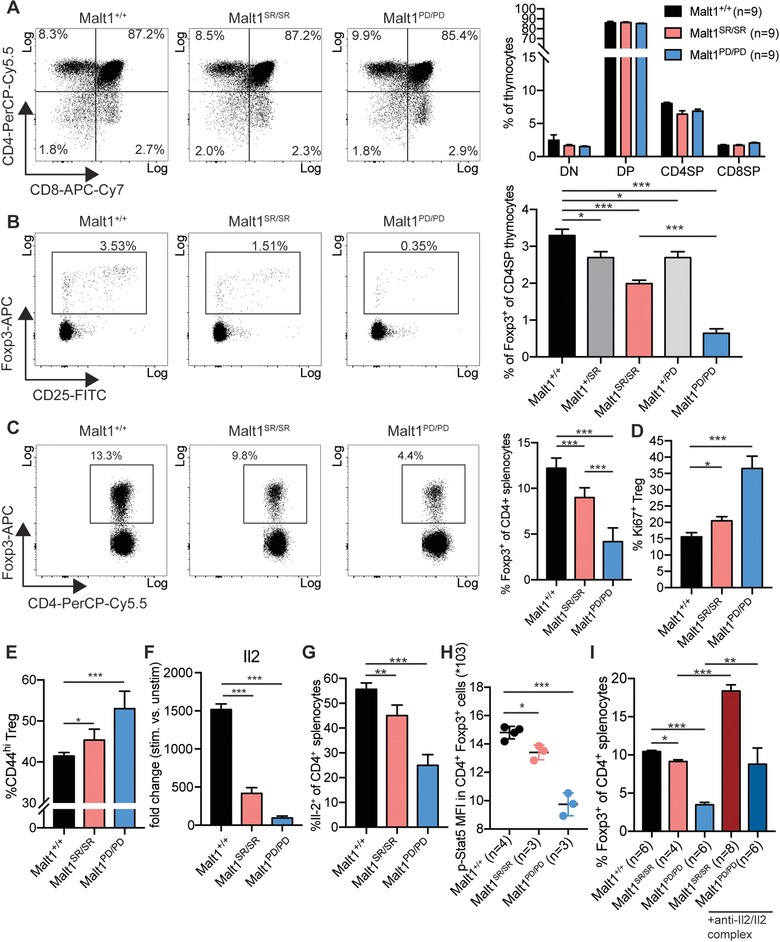
Figure 3.

Malt1 self‐cleavage is required for thymic Treg differentiation and impairs peripheral Treg homeostasis (A) Representative flow cytometry data and frequency CD4, CD8 double negative (DN), double positive (DP), CD4 single‐positive (CD4SP) and CD8 single‐positive (CD8SP) thymocytes. The data are shown as mean + SD of three pooled independent experiments, which were each performed in triplicates with three animals per group. (B) Representative flow cytometry data and frequency of Foxp3+ regulatory T cells within CD4SP thymocytes. The data are shown as mean + SD of three pooled independent experiments, which were each performed in triplicates with three animals per group. (C) Representative flow cytometry data and frequency of Foxp3+ Treg within CD4+ splenocytes. The data are shown as mean + SD of three pooled independent experiments, which were each performed in triplicates with three animals per group. (D) Treg proliferation was measured by Ki67‐positivity within CD4+ Foxp3+ splenocytes. The data are shown as mean + SD of three pooled independent experiments, which were each performed in triplicates with three animals per group. (E) Frequency of Treg with an activated/memory phenotype, as measured by the expression of CD44 and CD62L. The data are shown as mean + SD of three pooled independent experiments, which were each performed in triplicates with three animals per group. (F) Real‐time quantitative PCR analysis Il2 induction in stimulated versus unstimulated naïve CD4+ T cells from Malt1+/+, Malt1SR/SR and Malt1PD/PD mice (n = 3 animals per group). (G) Frequency of Il2 producing cells within the population of CD4+ T cells in mice of the different cohorts. Experiments were performed with Malt1+/+ (n = 12), Malt1SR/SR (n = 9) and Malt1PD/PD (n = 10) mice in three independent experiments. Data were pooled and are shown as mean + SD. (H) Mean florescence intensity (MFI) of phospho‐Stat5 (Tyr694) in CD4+ Foxp3+ cells are shown as mean + SD for two pooled experiments with 4 mice per group. (I) Frequency of CD4+ Foxp3+ cells in mouse splenocytes of the different cohorts after treatment with the anti‐Il2/Il2 complex or control treatment. Data are shown as mean + SD with Malt1+/+ n = 6, treated Malt1SR/SR n = 8, treated Malt1PD/PD n = 6, untreated Malt1SR/SR n = 4, untreated Malt1PD/PD n = 6 animals per group.
