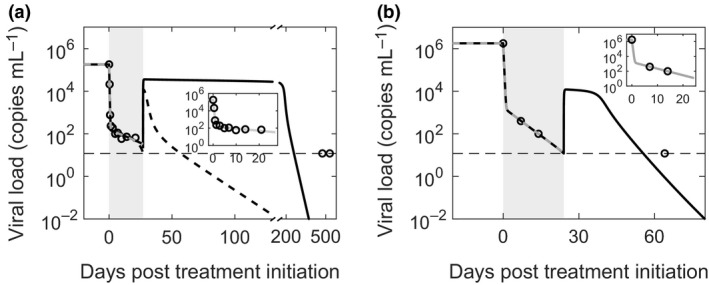
Figure 3.

Comparisons with patient data. Model predictions (solid lines) compared with data (symbols) from two patients, shown separately in a and b, who achieved EOT +/SVR (see text for details of the patients). The best‐fits to the data during therapy are shown superimposed (gray dashed lines) and in expanded view (insets). The best‐fit parameter estimates and their 95% CIs are as follows: (a) δ = 0.059 (0.026–0.091) day−1, ε = 0.9991 (0.9988–0.9994), and c = 6.3 (5.8–6.8) day−1. These yielded p = 4.4 virions cell−1 day−1 and m = 0.24 mL cells−1 day−1. The minimal values of dE = 4 per day and kD = 2.67 × 10⁴ cells mL −1 (see Methods) yielded SVR just before the last measured time point (solid line). The low second phase slope (δ = 0.059 day−1), implying weak effector killing of infected cells, and the long gap between the EOT and the last measurement yielded best‐fit parameters that predicted high viremia over extended durations past the EOT, which may be unrealistic. A low second phase slope may also arise due to infected cell proliferation despite strong effector killing. A model that included cell proliferation (Supplementary text 1; Supplementary figure 1) captured the data well and resulted in rapid viral load reduction past the EOT leading to SVR within a few weeks (dashed line). During the period under treatment, predictions of the two models are indistinguishable. (b) δ = 0.204 (0.200–0.208) day−1. ε = 0.9991 and c = 6.3 day−1 were the same as in a. These yielded p = 35.7 virions cell−1 day−1 and m = 1.36 mL cells−1 day−1. Furthermore, dE = 6 day−1 and kD = 1.95 × 10³ cells mL −1 were the minimal estimates. The limit of detection is shown as a thin dashed line. The other parameter values employed are in Table 1.
