
Figure 4.
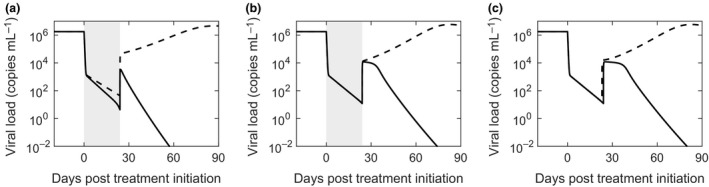
Dependence of EOT +/SVR on parameter values. Model predictions of viral load changes under conditions leading to EOT +/SVR (solid lines) and treatment failure (dashed lines). (a) m = 1.5 mL cells−1 day−1 (solid) and m = 1 mL cells−1 day−1 (dashed); (b) kD = 2 × 10³ cells mL−1 (solid) and 1 × 10³ cells mL−1 (dashed); (c) m = 1.36 mL cells−1 day−1; τ d = 24 days (solid) and 23 days (dashed). The treatment period is shaded in a and b. The other parameter values employed are in Table 1 corresponding to Figure 3b.