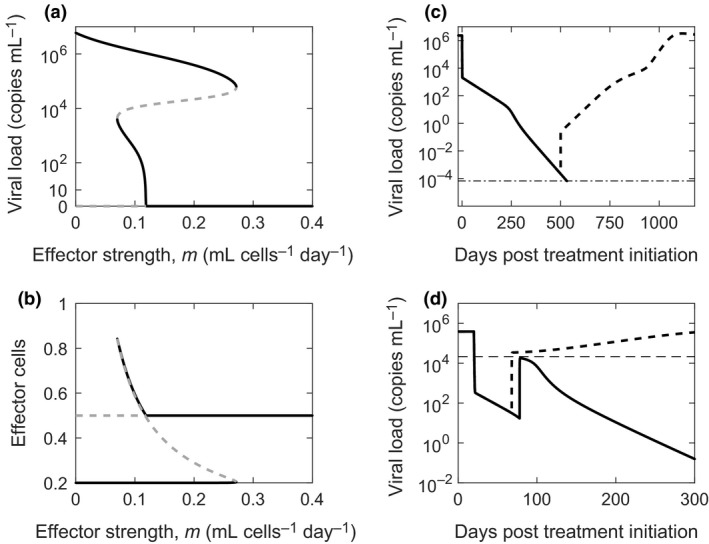
Figure 5.

Bistability and treatment outcomes. Bifurcation diagrams indicating stable (black) and unstable (gray) steady state viral loads (a) and effector cell populations (b) as functions of the strength of the effector response, m. Viral load changes during and after therapy when m = 0.055 mL cells−1 day−1 (c) and m = 0.2 mL cells−1 day−1 (d). In c, τ d = 500 days (dashed line) and 552 days (solid line). The thin dot‐dashed black line marks the cure boundary. In d, τ d = 48 days (dashed line) and 58 days (solid line). The thin dashed line marks the unstable steady state viral load when m = 0.2.
