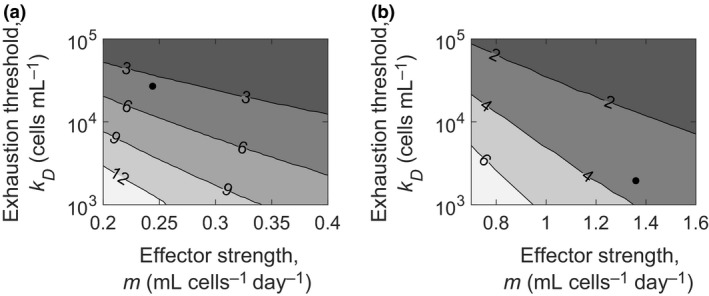
Figure 6.

Minimum required treatment duration. Contour plots of model predictions of the minimum treatment duration required in weeks to achieve SVR as functions of the parameters m and kD with the other parameters representative of the patient data in (a) Figure 3a and (b) Figure 3b. The parameter values defining the patients are shown as black dots.
