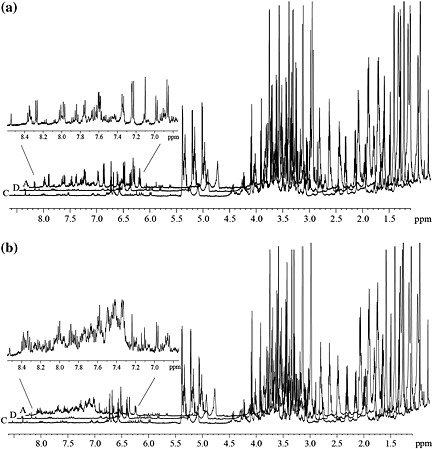
Figure 1.

1H NMR spectra (500 MHz, MeOH‐d 4) of crude extracts of Musa leaf tissues from varieties ‘Williams’ (a) and ‘KTR’ (b). Extracts were prepared from necrotic areas of the infected half (Fig. 2, A) and the non‐infected half (D) of a leaf treated with M. fijiensis strain E22, and a leaf of an untreated control plant (C) was taken 35 d after inoculation with fungal conidia. The extensions show the 1H NMR signals of induced phenolics in the necrotic leaf areas (A). Spectral intensities were scaled with the signal of trimethylsilyl propanoic acid (TSP), which was added as an internal standard.
