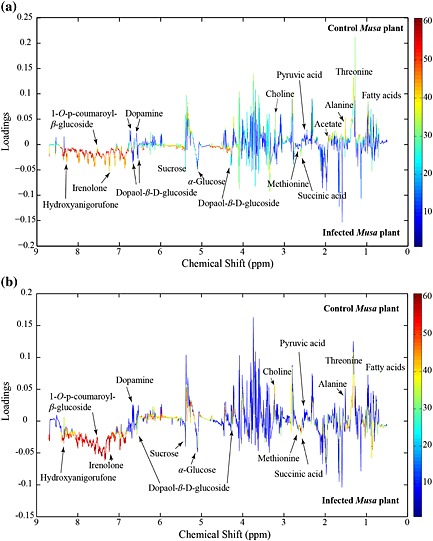
Figure 3.

Loading plots for principal component analysis (PCA) model shown in Fig. 2a,b displaying the regions of the metabolites with strong influence (in red and orange) and the metabolites with less influence (light blue and dark blue) during the group discrimination observed in the PCA analysis. (a) ‘Williams’ and (b) ‘Khai Thong Ruang’ (‘KTR’) Musa varieties.
