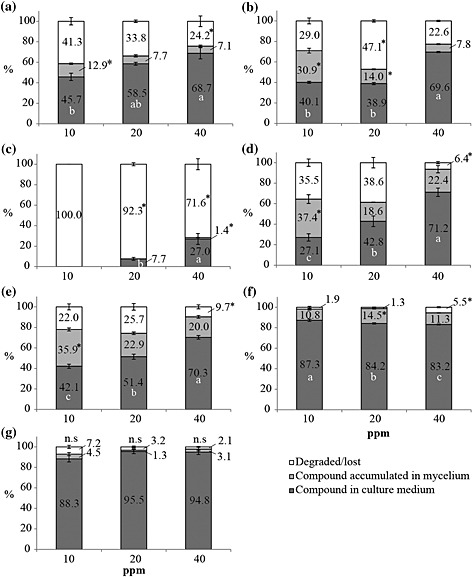
Figure 7.

Quantification of phenylphenalenones after incubation of M. fijiensis strain Ca10_13 with different doses (0.01, 0.02 and 0.04 mg mL−1) of the specified compound. Data were normalized as a percentage based on the peak area generated by high‐performance liquid chromatography (HPLC)–diode array detector (DAD) analysis of the negative controls of each compound. Phenylphenalenone recovery from culture medium (dark‐grey bars), mycelium (light‐grey bars) and the unrecovered portions of phenylphenalenones were determined as the difference between the applied dose and the concentration determined in the medium and the mycelium after 8 d of incubation (white bars). (a) Isoanigorufone (11); (b) anigorufone (9); (c) hydroxyanigorufone (5); (d) 4′‐O‐methylirenolone (12); (e) 4′‐O‐methylanigorufone (10); (f) methoxyanigorufone (7); and (g) 2‐phenyl‐1,8‐naphthalic anhydride (3). Different letters or asterisks indicate significant differences among treatments (concentrations) of the compound analysed [one‐way analysis of variance (anova), Holm–Sidak post hoc test: P < 0.05; n.s: not significant].
