Figure 2.

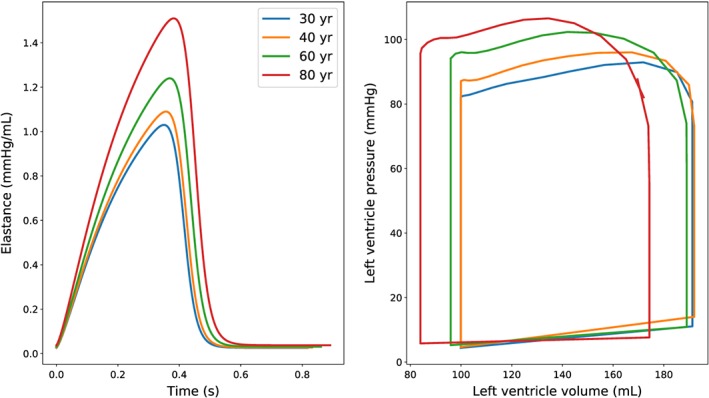
Elastance curve (left) and left ventricle pressure‐volume diagram (right) for different ages. The right plot shows left ventricle quantities calculated immediately after 10 seconds of simulation

Elastance curve (left) and left ventricle pressure‐volume diagram (right) for different ages. The right plot shows left ventricle quantities calculated immediately after 10 seconds of simulation