
Figure 1.
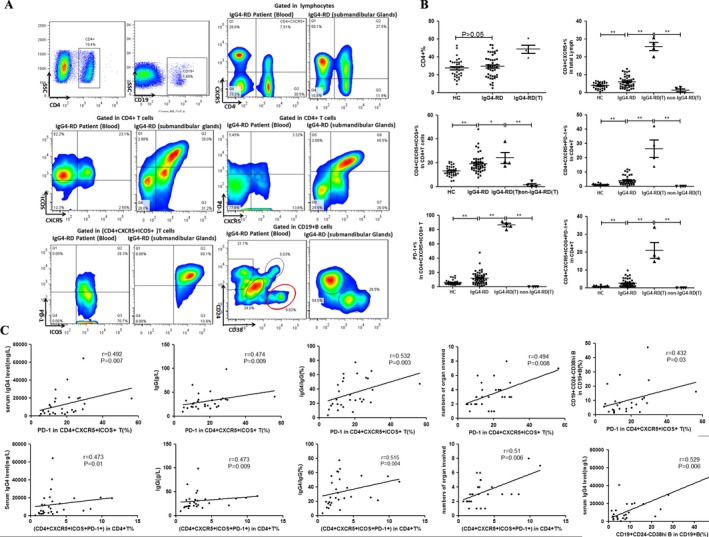
Expression of follicular helper T (Tfh) cells and plasmablasts in patients with IgG4‐related disease (IgG4‐RD) compared to healthy controls (HC). A and B, Flow cytometric detection (A) and quantification (B) of total CD4+ T cells, CD4+CXR5+ T cells, CD4+CXCR5+ICOS+ T cells, CD4+CXCR5+PD‐1+ T cells, programmed cell death protein 1 (PD‐1) in CD4+CXCR5+ICOS+ T cells, and CD19+CD24−CD38high plasmablasts in peripheral blood and submandibular gland tissue (T) from patients with IgG4‐RD and healthy controls. Symbols represent individual subjects; horizontal lines with bars show the mean ± SD. * = P < 0.05; ** = P < 0.001. C, Correlations between the percentages of PD‐1 in CD4+CXCR5+ICOS+ T cells and CD4+CXCR5+ICOS+PD‐1+ T cells and serum levels of IgG4, serum levels of IgG, IgG4:IgG ratio, numbers of involved organs, and percentage of CD19+CD24−CD38high plasmablasts. ICOS = inducible T cell costimulator.