
Figure 3.
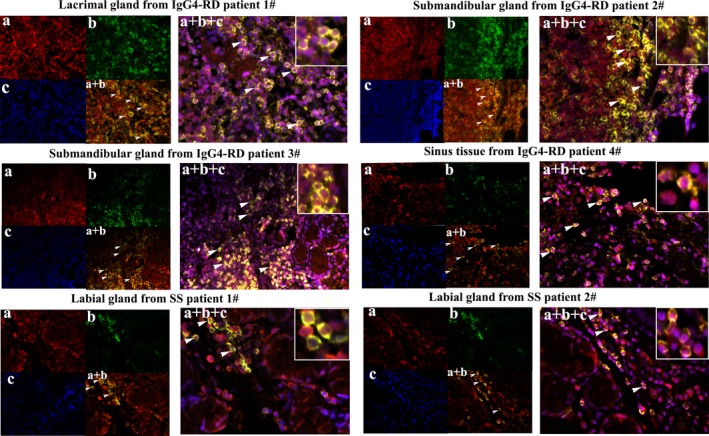
Immunofluorescence staining of Tfh cells in the involved tissue (lacrimal glands, submandibular glands, and sinus tissue) from patients with IgG4‐RD compared to labial glands of control patients with Sjögren's syndrome (SS) (stained with the same concentration of primary antibodies). a, CXCR5 (in red). b, CD4 (in green). c, DAPI counterstaining for cell nucleus (in blue). a + b, Merged image of CD4 and CXCR5 immunostaining. a + b + c, Merged image of CD4, CXCR5, and DAPI immunostaining. White arrowheads indicate positive cells. Insets show higher magnification views of the merged images. Original magnification × 400. See Figure 1 for other definitions.