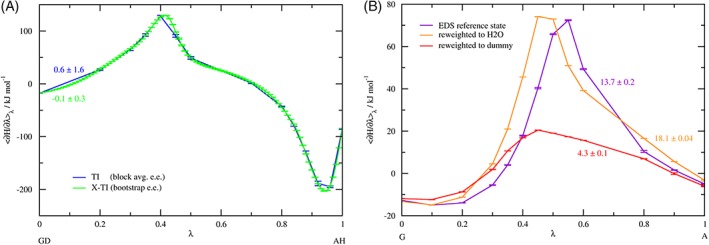
Figure 7.

Characteristic TI profiles, using the full number of λ‐points. a) Comparison of the TI and X‐TI profile for KGK‐Dummy ↔ KAK‐H2O (GD‐AH), at 1 ns simulation time per λ‐point. b) EDS‐TI profiles obtained (after 50 ns simulation time per λ‐point) by reweighting the EDS reference state that was propagated along λ to the respective water end states. The numbers next to the lines give the integrated free‐energy difference in kJ mol−1. [Color figure can be viewed at http://wileyonlinelibrary.com]
