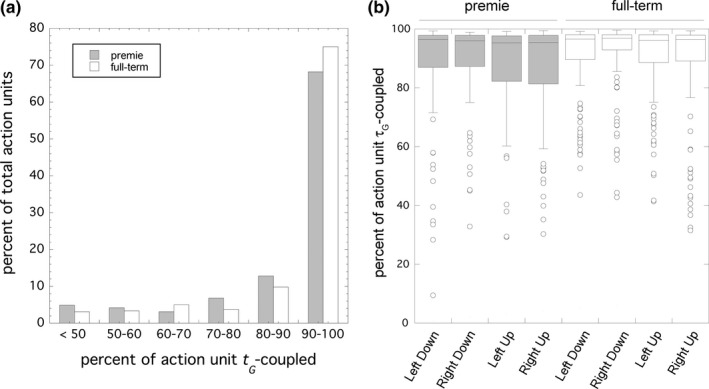
Figure 3.

(a) The number of action units plotted against the percent of the action unit that was τG ‐coupled for premie (shaded bars) and full‐term (white bars). The higher the percentage, the more of the action unit conformed to the τG ‐guidance model, with r 2 > 0.95. Those action units where more than 90% of the movement was τG ‐coupled were considered to support the model. Note the reduced proportion of premie movements in this category. (b) Box plot of the percent of the action unit that was τG ‐coupled for each hand and each direction of movement (“up” means a postero‐anterior movement towards the head and “down” means an antero‐posterior movement towards the waist) for premie (shaded boxes) and full‐term (white boxes)
