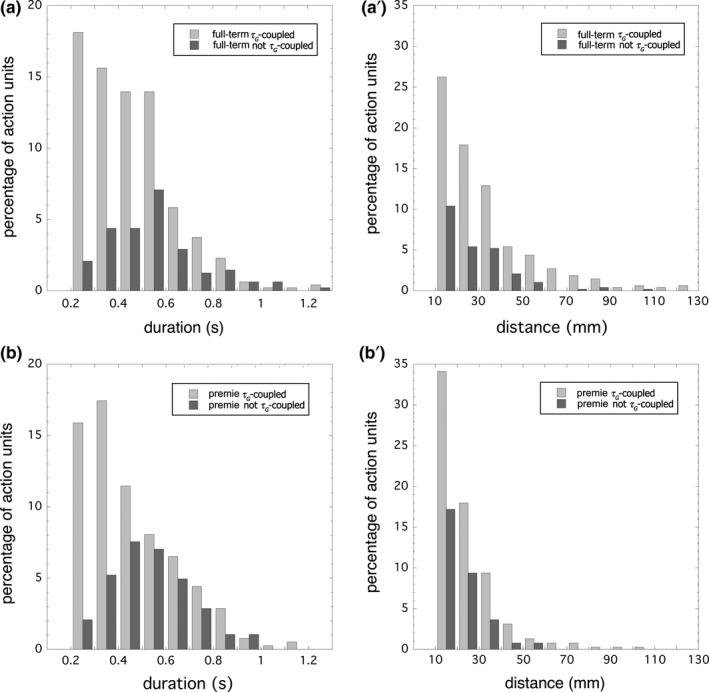
Figure 4.

Distributions of duration and distance for full‐term (a, a’, respectively) and premie (b, b’, respectively) arm action units that conformed (percent τ G ‐coupled > 90%) and did not conform (percent τ G ‐coupled < 90%) to the τG ‐coupling model. The shapes of the conforming and non‐conforming distributions are different for duration (a, b) but not for distance (a’, b’)
