
Figure 3.
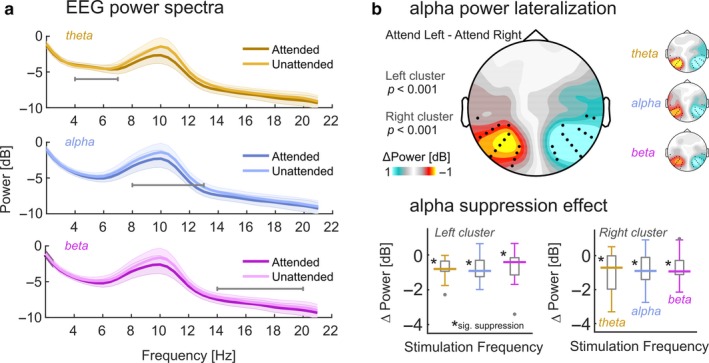
Attentional allocation produces alpha lateralisation. (a) Log‐power spectra during theta‐band (golden), alpha‐band (blue), and beta‐band (purple) stimulation collapsed across electrode clusters depicted in (b) and aggregated across “Attend Left” and “Attend Right” conditions to reveal the attention effect on alpha power. Note the prominent difference in the range 8–12 Hz. Shaded errors show pointwise standard error of the mean. Horizontal grey lines indicate respective stimulated frequency ranges. (b) Scalp map depicts alpha lateralisation collapsed across stimulation conditions during spatially focussed attention. Warm colors signify lateralisation of alpha power when subjects focus towards the right hemifield. Cool colors signify focus towards the left hemifield position. Black dots indicate two clusters of electrodes that demonstrated significant lateralisation (both p < .001, cluster corrected) and that were used in further analyses. Small inset scalp maps on the right illustrate condition specific alpha lateralisation. (c) Boxplots depicting distributions of alpha suppression effects (Attended minus Unattended alpha power) for the three stimulation frequency bands and for left and right hemispheric electrode clusters (see b), separately. Boxes cover the interquartile range, strong horizontal lines signify medians. Grey dots represent outliers. Asterisks near median lines demarcate significant suppression on a Holm–Bonferroni corrected alpha level (PHB <.05).