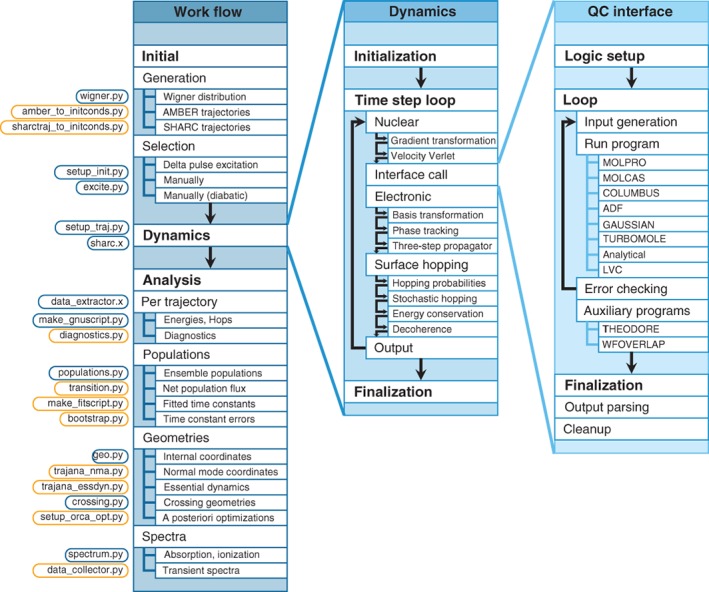
Figure 3.

Work flow of SHARC2.0 dynamics simulations. The left column shows the work flow on the ensemble level, including the preparation (initial conditions), dynamics, and analysis steps, each with applicable options. The labels on the left give the names of the SHARC2.0 subprogram, which performs the respective task. Subprograms which are new with respect to the original implementation of SHARC are marked in orange. The middle column shows the work flow inside the dynamics driver, on a trajectory level. The right column shows, on the time step level, the work flow of the quantum chemistry (QC) interface
