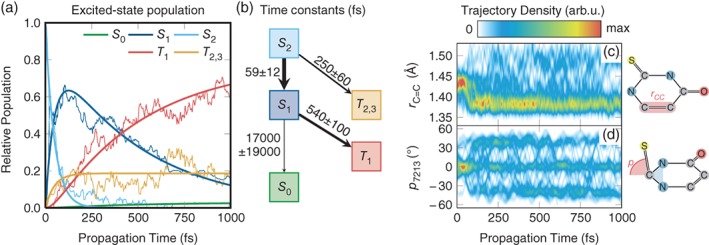
Figure 4.

Overview over results obtained from SHARC simulations for 2‐thiouracil using the MS‐CASPT2(12,9)/cc‐pVDZ method (Mai, Marquetand, & González, 2016). In (a), the time‐dependent populations (thin lines) and kinetic model fits (thick lines). In (b), the assumed kinetic model with the obtained fit parameters and errors. In (c) and (d), the temporal evolution of two key geometric parameters (C=C bond length and thiocarbonyl pyramidalization angle). (Reprinted with permission from Mai, Marquetand, and González (2016). Copyright 2016 ACS, published under CC‐BY license)
