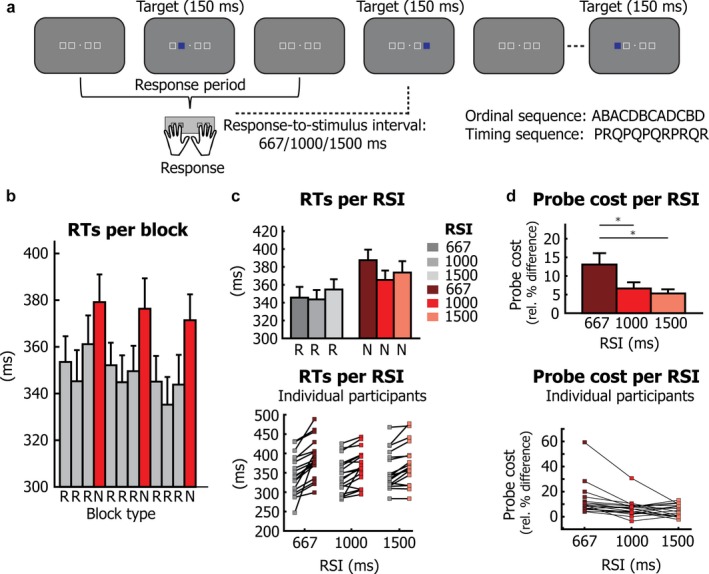
Figure 1.

Task and behavioural results. (a) Four white squares displayed on a grey background outlined four possible target locations. Each target location corresponded to one of four buttons, to be pressed with the left and right middle and index fingers. Every time a blue target appeared in one of the four target locations, the corresponding button had to be pressed. Unknown to participants, both the order of targets and the order of response‐to‐stimulus intervals (RSIs) followed a repeating twelve‐element cycle. Three different RSI lengths were used: 667, 1000 and 1500 ms. Two different block types were presented: repeated sequence (R) blocks, containing eight repetitions of the twelve‐element cycle and new sequence (N) blocks in which a new spatial‐temporal sequence was presented. (b) Reaction times per block in the MEG session (prior to this session, incidental sequence learning had already been established in a behavioural session; see Heideman et al., 2017 for data showing the learning of the repeated sequence). Results for repeated sequence (R) blocks are shown in grey, while results for new sequence blocks (N) are shown in red. (c) Reaction times for each of the three RSI durations, separate for repeated sequence (R) and new sequence (N) blocks. The bottom plot reflects individual participant averages. (d) The probe cost was calculated as the relative difference between the average of all repeated sequence (R) and all new sequence (N) blocks, for each RSI length. The bottom plot shows results for each individual participant. Error bars present standard errors of the means (±1 SEM), calculated using the variance across participants. Asterisks indicate statistically significant effects.
