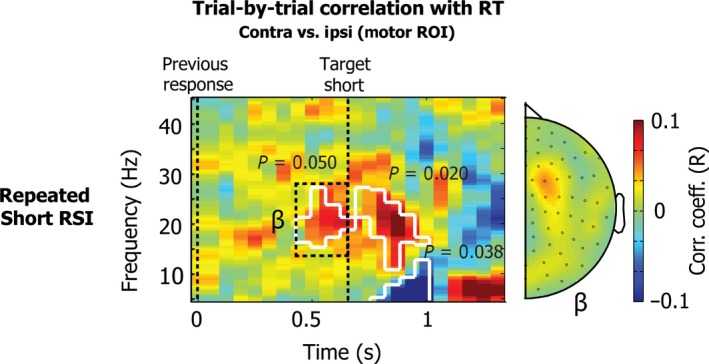
Figure 4.

Trial‐by‐trial correlations between power and RT for the short RSI (667 ms) in the repeated condition. The data show the Pearson correlation coefficient for each time‐frequency point between 5 and 45 Hz, for the contra vs. ipsi contrast, locked to the previous button press. Data are plotted for the motor ROI channels shown in Fig. 2a. The topography shows the average for the beta (15–28 Hz) frequency band, for a window between 400 and 667 ms after the button press (i.e. just before the presentation of the short target). Significant clusters are outlined in white. The topography reflects results for contralateral vs. ipsilateral activity in symmetrical channel pairs.
