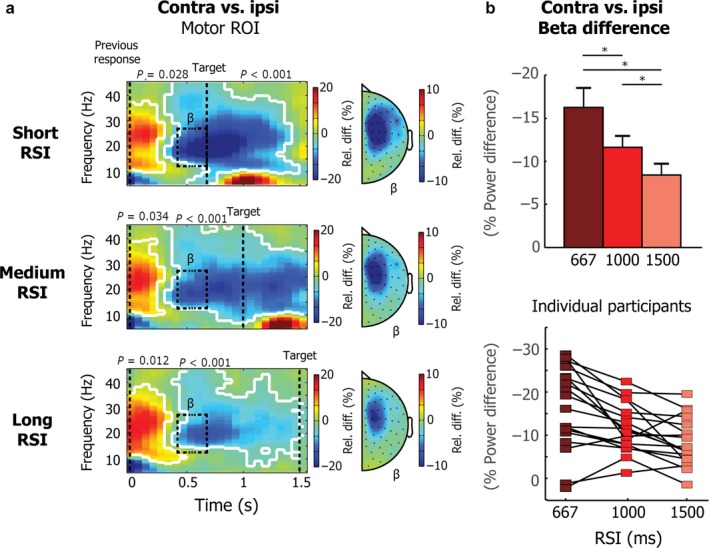
Figure 5.

Beta power differences between contralateral and ipsilateral motor channels for all three RSIs. (a) TFR plots reflect frequencies between 5 and 45 Hz, locked to the preceding button press, which always occurred with the opposite hand, compared to the (anticipated) current target. Data are shown for the motor ROI channel selection shown in Fig. 2a. Results are shown for targets that occurred either after a short RSI (667 ms; top plot), medium RSI (1000 ms; middle plot) or a long RSI (1500 ms; bottom plot). Significant clusters are outlined in white. Topographies show averages for the beta (15–28 Hz) band, for a window between 400 and 667 ms after the button press. (b) Beta power difference between contralateral and ipsilateral motor channels for the same time and frequency selection as used for the topographies in a. The bottom plot shows individual participant data. Asterisks indicate statistically significant effects.
