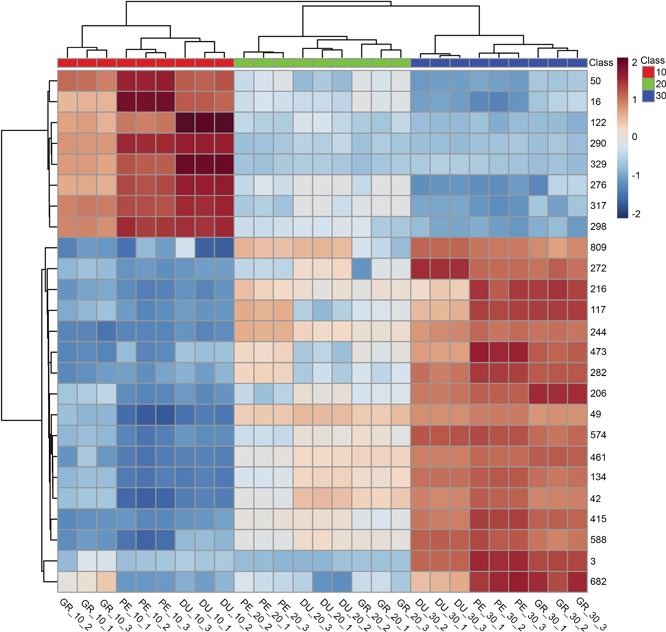
Figure 5.

Heatmap with most significant metabolites affected by temperature treatments Heatmap plot with the 25 top‐ranking metabolites from the partial least squares discriminant analysis variable importance in projection (PLS‐DA VIP). Metabolites are represented as numbers on the right‐hand side of the plot, using the metabolite number (metabolite ID) obtained from the data processing. Eucalyptus species (DU – E. dunnii, GR – E. grandis, PE – E. pellita) and temperature treatments (10°C, 20°C and 30°C) are identified in the bottom of the plot.
