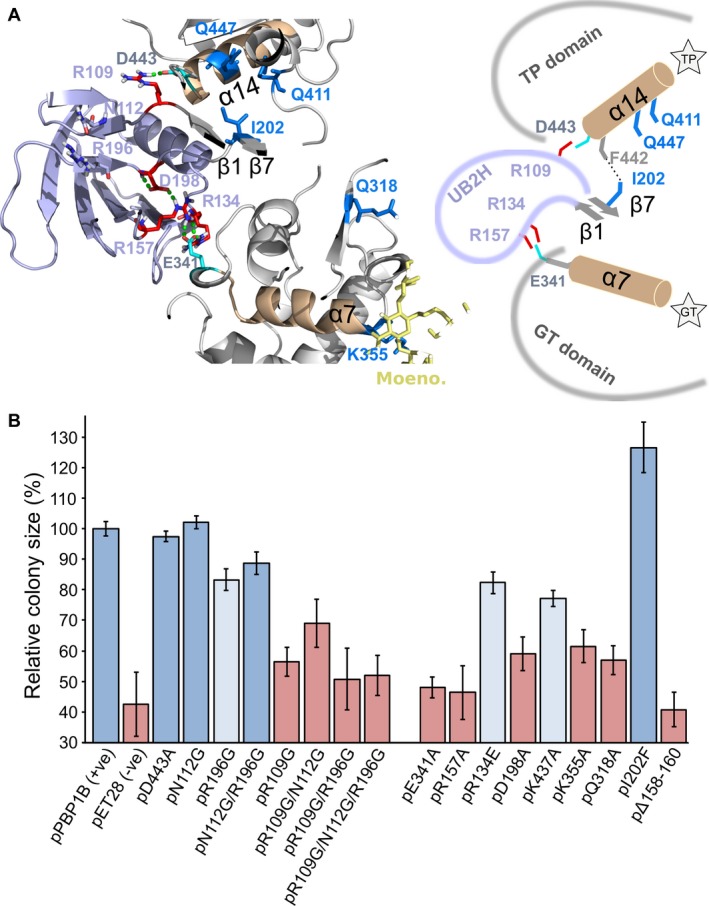
Figure 2.

Perturbation of the putative activation pathways. A. H‐bond network connecting points of structural change in UB2H domain with the other domains of PBP1B (green dashed lines between residues) (PDB code 5FGZ). This network involves residues (coloured in red) mainly located in the N‐ and C‐terminal segments and in Loop 1 (residues 109‐114, 196‐200 and 157‐168, respectively) ultimately connecting the UB2H domain with residue D443 of the TPase domain, and residue E341 of the GTase domain. Residues coloured in blue represent the mutations of PBP1B that partially bypass the need of LpoB activation (Markovski et al., 2016). B. In vivo function of PBP1B versions as measured by cellular fitness under cefsulodin treatment (6 μg/mL). Cefsulodin primarily targets PBP1A, increasing the cell’s dependence on PBP1B. Colony size relative to the strain expressing WT PBP1B is used as proxy of cellular fitness; growth of the strain harbouring the empty vector represents basal growth (mean ± SD; n = 16). Each bar is coloured according to survival of the strain harbouring the specific PBP1B version once mrcA (encoding PBP1A) was deleted in three independent experiments. Blue, growth similar to WT; light blue, diminished growth compared to WT (≤ 50%); red, no growth. Expression of PBP1B versions from their pET28 vector in BW25113 ΔmrcB was not induced, relying on basal expression from a cryptic promoter (Egan et al., 2014). [Colour figure can be viewed at http://www.wileyonlinelibrary.com]
