
Figure 3.
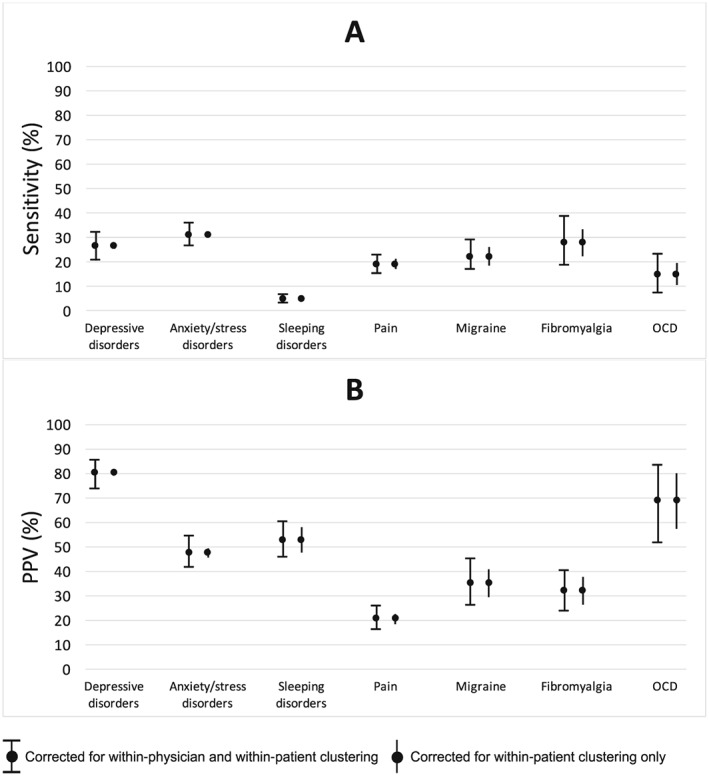
Variance of the sensitivity and positive predictive value (PPV) estimates when corrected for both within‐physician and within‐patient clustering versus within‐patient clustering only. The figure shows the width of the 95% CIs around the sensitivity (panel A) and PPV estimates (panel B) when a 2‐stage cluster bootstrap28 was used to correct for clustering of prescriptions within patients who in turn were nested within physicians (capped vertical bars) versus when a 1‐stage cluster bootstrap was used to correct for only clustering of prescriptions within patients (uncapped vertical bars). The upper and lower bounds of the 95% CI correspond to the values of the 2.5th and 97.5th percentiles of the distribution of the respective estimates across 1000 bootstrap re‐samples. Results are shown for the 7 most common treatment indications based on diagnostic codes recorded in administrative data within ±3 days of the prescription date