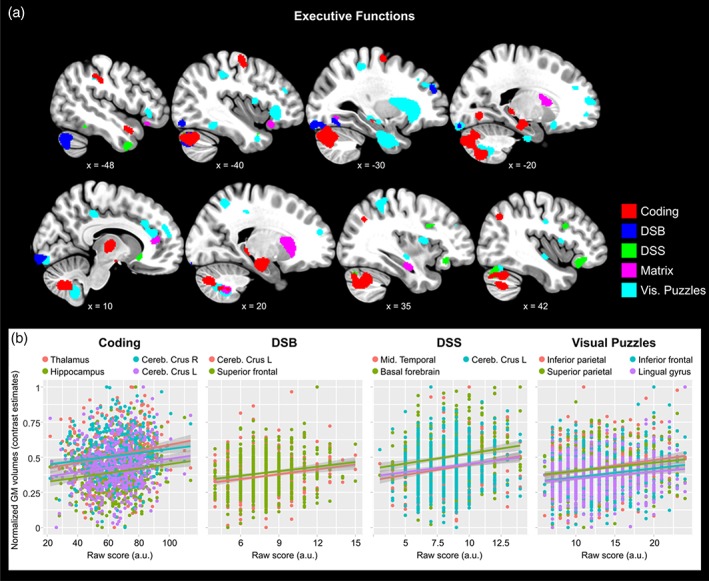
Figure 2.

Better performance in executive functions (EFs) was predicted by larger GMv in different brain regions. (a) Clusters representing the brain regions where larger GMv predicted better EFs performance, projected over sagittal slices. Different subscales of the WAIS are color‐coded accordingly. Coordinates are provided in the Montreal Neurologic Institute (MNI) standardized space. For visualization purposes the maps are thresholded at uncorrected p < .005 (k = 100). (b) Group scatterplots showing significant positive linear relationships between regional GMv and EFs in different WAIS subtests. GMv values are adjusted for age, sex, years of education, and total intracranial volume (TIV). Shaded areas indicate 90% confidence intervals (Coding; DSB = Digit‐span backwards; DSS = digit‐span sequence; Visual Puzzles) [Color figure can be viewed at http://wileyonlinelibrary.com]
