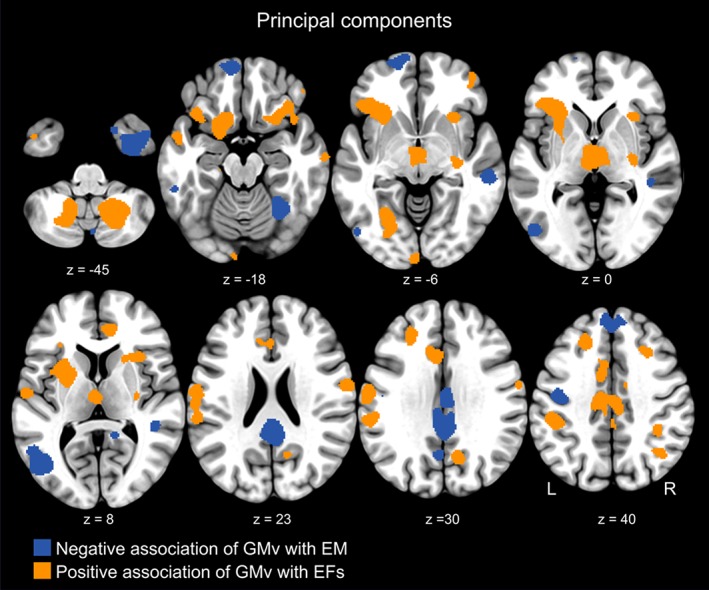
Figure 4.

The cerebral morphological correlates underlying EM and EFs were spatially segregated. Superimposition of clusters representing the brain regions computed for the principal components (PCs) relative to EM and EFs. The PC encapsulating EM performance was related to lower GMv in regions such as the posterior cingulate cortex, the medial aspect of the superior frontal cortex, and the posterior middle temporal gyrus. By contrast, the PC representing performance in EFs mapped onto a different set of regions comprising superior as well as inferior frontal regions, inferior parietal, thalamus, cerebellum, and the medial orbitofrontal gyrus. For visualization purposes the maps are thresholded at uncorrected p < .005 (k = 100) [Color figure can be viewed at http://wileyonlinelibrary.com]
