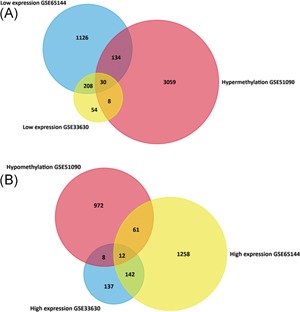
Figure 2.

Identification of aberrantly methylated and differentially expressed genes was analyzed by Funrich software. Different color areas represented different datasets. (A) Hypermethylation and low expression genes. (B) Hypomethylation and high expression genes
