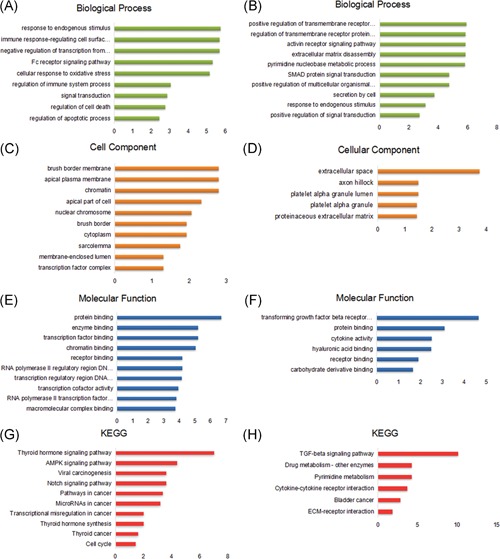
Figure 4.

The gene ontology annotation and pathway enrichment analysis of all the aberrantly methylated and differentially expressed genes. (A) Biological process, (C) cellular component, (E) molecular function, and (G) KEGG of hypermethylation/low‐expression genes. (B) Biological process, (D) cellular component, (F) molecular function, and (H) KEGG of hypomethylation/high‐expression genes. The high enrichment score means that the genes were found more frequently in the particular ontology. KEGG, Kyoto Encyclopedia of Genes and Genomes
