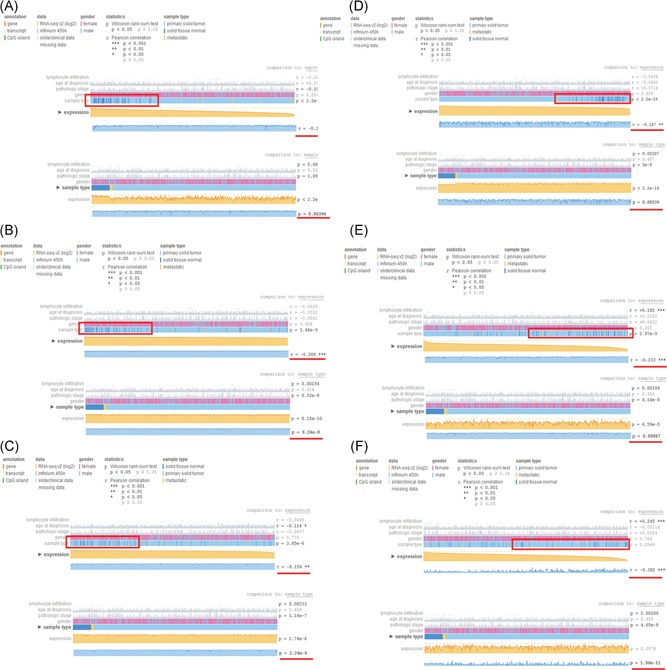
Figure 7.

Validation of the hub genes in the TCGA database. In the default MEXPRESS plot, the samples are ordered by their expression value. These views show how hub gene expression and methylation are negatively correlated, which are confirmed by the Pearson correlation coefficients on the right. (A‐C) For the hypermethylation/low‐expression hub genes, normal samples tended to have higher expression than tumor samples. (D‐F) However, tumor samples tended to have higher expression than normal samples for hypomethylation/high‐expression hub genes. TCGA, the Cancer Genome Atlas
