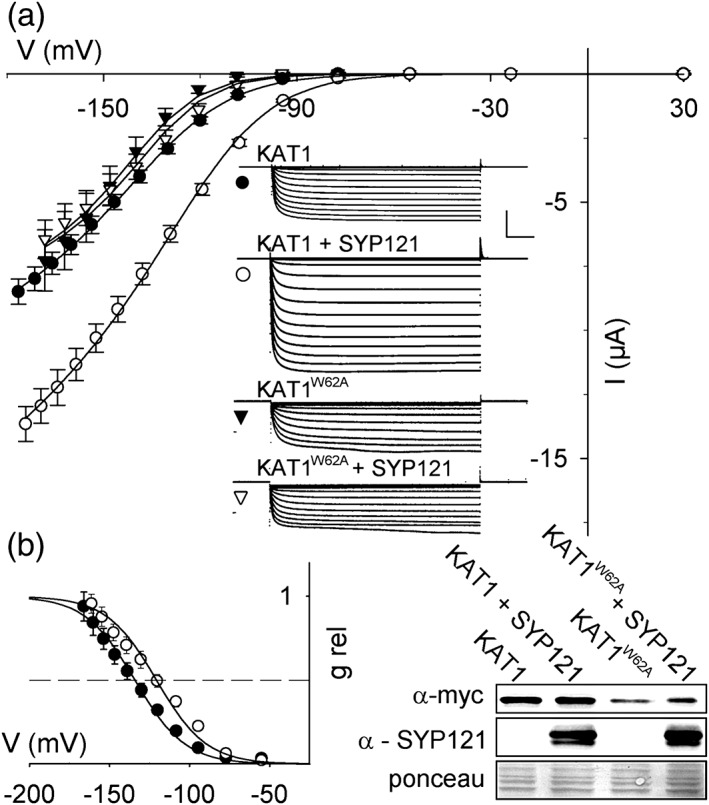
SYP121 enhances whole‐cell KAT1 current. (a) Steady‐state current–voltage curves (means ±
SE,
n > 5 for each data set) and representative current traces recorded on expressing KAT1 (circles) and the non‐interacting KAT1
W62A mutant (triangles) without (filled symbols) and with SYP121 (open symbols) using a 1:4 molar ratio of cRNAs (Grefen et al.,
2015; Honsbein et al.,
2009). Voltage was stepped from a holding voltage of −20 mV to voltages from +30 mV to −180 mV. Solid curves are the results of joint, least squares fitting to the Boltzmann function
where g
max is the conductance maximum, E
K is the equilibrium voltage for K
+, V
1/2 is the voltage at mid‐point for maximal conductance; δ is the apparent gating charge or voltage sensitivity coefficient. F, R, and T have their usual meaning. Mean g
max increased from 0.061 ± 0.009 to 0.096 ± 0.006 mS, and V
1/2 shifted from −132 ± 1 mV to −119 ± 1 mV with SYP121 (
P < 0.001). KAT1
W62A current shown scaled (multiplied) by 4 for comparison; its parameters were unaffected by SYP121 (g
max, 0.013 ± 0.002 mS; V
1/2–136 ± 2 mV).
Insets: Representative current traces cross‐referenced by symbol. Scale: 5 μA (vertical), 1 s (horizontal). (b) Relative conductance‐voltage curves for KAT1 ± SYP121 from (a). Symbols are corresponding tail current amplitudes scaled with the midpoint to give 0.5. Solid line is the fitting of Boltzmann function derived as g/g
max Equation
(3). Dashed line marks 0.5 g
max. Immunoblot analysis of myc‐tagged KAT1 and SYP121 from representative oocytes collected after recordings. Ponceau is included as a loading control

