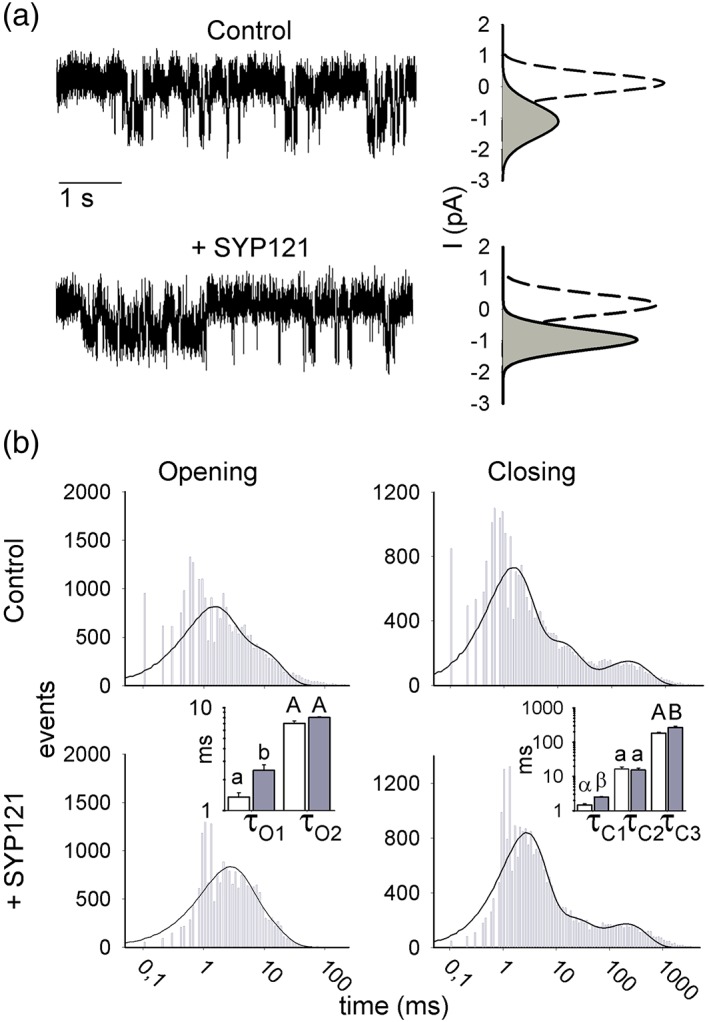
Figure 2.

SYP121 alters both open and closed lifetimes of KAT1. (a) Representative single‐channel currents from inside–out patches recorded at −120 mV for KAT1 alone (above) and with SYP121 (below) with fitted amplitude histograms for the open (solid lines, grey fill) and close state (dashed lines). Open‐state curves are scaled (multiplied) by 4 relative to the closed state for clarity. Amplitudes: 1.06 ± 0.21 pA (KAT1), 1.05 ± 0.11 pA (KAT1 + SYP121). (b) Frequency histograms of KAT1 open and close durations for KAT1 alone (above) and with SYP121 (below) plotted on logarithmic scales. Solid lines are fittings to Equation (2) to extract the dwell time constants. Bins below 1 ms (Nyquist limit) are shown but were not included in fittings. Open and closed lifetimes were fitted satisfactorily with sums of two and three exponentials, respectively. Mean dwell time constants ±SE (n = 4) for open and closed lifetimes are summarized by the bar charts (KAT1, open bars; KAT1 + SYP121, filled bars). Significant differences ±SYP121 are indicated by lettering (see Table 1) [Colour figure can be viewed at http://wileyonlinelibrary.com]
