
Figure 3.
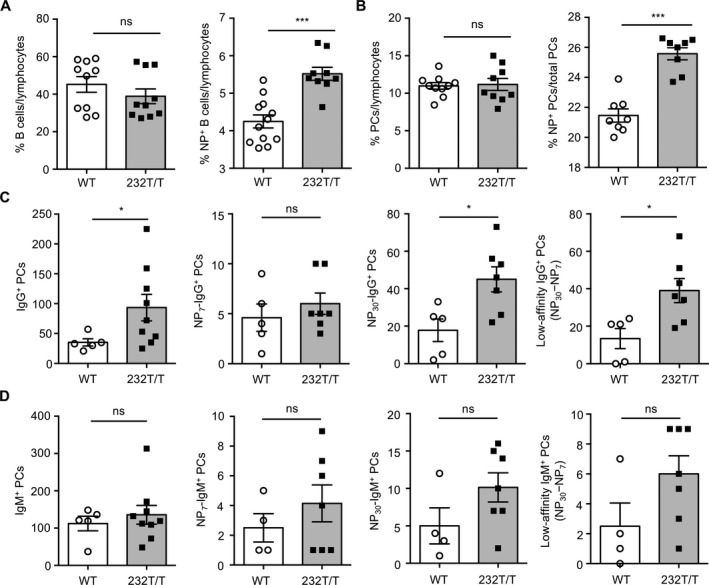
Increased frequency of low‐affinity NP+IgG+ plasma cells (PCs) in the spleen in FcγRIIb232T/T mice after secondary immunization. A and B, Percentages of CD19+ B cells (P = 0.2846) and NP+CD19+ B cells (P = 0.0007) (A) and percentages of CD19+CD138+ PCs (P = 0.8432) and NP+CD19+CD138+ PCs (P = 0.0009) (B) in splenic lymphocytes from wild‐type (WT) mice and FcγRIIb232T/T mice on day 35, analyzed by flow cytometry. C, Splenic total IgG+ PCs (P = 0.0315), high‐affinity NP7‐specific IgG+ PCs (P = 0.4318), total NP30‐specific IgG+ PCs (P = 0.0168), and low‐affinity NP+IgG+ (NP30 minus NP7) PCs (P = 0.0159) in WT mice and FcγRIIb232T/T mice on day 35, determined using enzyme‐linked immunospot assays (using 6 × 10³ cells to detect total PCs and 2.4 × 10⁴ cells to detect NP+ PCs). D, Numbers of total IgM+ PCs (P = 0.5412), NP7‐specific IgM+ PCs (P = 0.355), NP30‐specific IgM+ PCs (P = 0.116), and low‐affinity NP+IgM+ (NP30 minus NP7) PCs (P = 0.0864) in WT mice and FcγRIIb232T/T mice. Symbols represent individual mice; bars show the mean ± SEM (n = 8–12 WT mice and 8–10 FcγRIIb232T/T mice in A and B; n = 5 WT mice and 7–9 FcγRIIb232T/T mice in C; n = 4–5 WT mice and 7–9 FcγRIIb232T/T mice in D). * = P < 0.05; *** = P < 0.001. NS = not significant.