Figure 3.

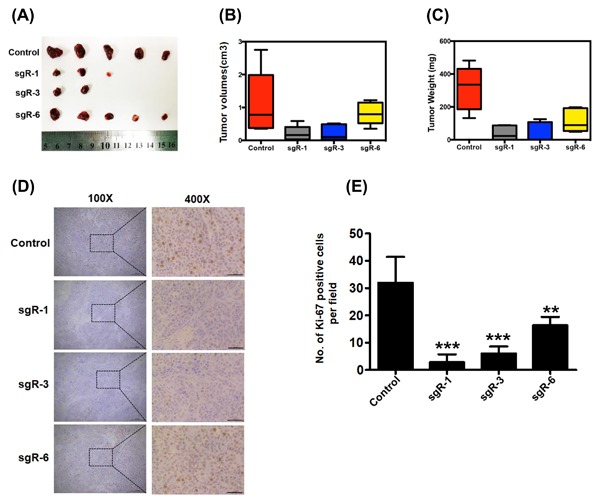
Tumorigenic potential was reduced in HBsAg knockout PLC/PRF/5 HCC cells. (A) Tumor images in the indicated cell lines 7 weeks after inoculation. (B) Final tumor volumes are summarized in the chart. The average tumor volume was expressed as the mean ± SD of five mice. (C) Total tumor weight from each group of mice was calculated and shown. The data are presented as mean ± SD. (D and E) Expression of Ki‐67 in the xenograft tumor tissues was examined by IHC staining. Scale bars: 50 μm. Data are presented as mean ± SD. P values were calculated using a Student's t‐test. ***P < 0.001, **P < 0.01, *P < 0.05
