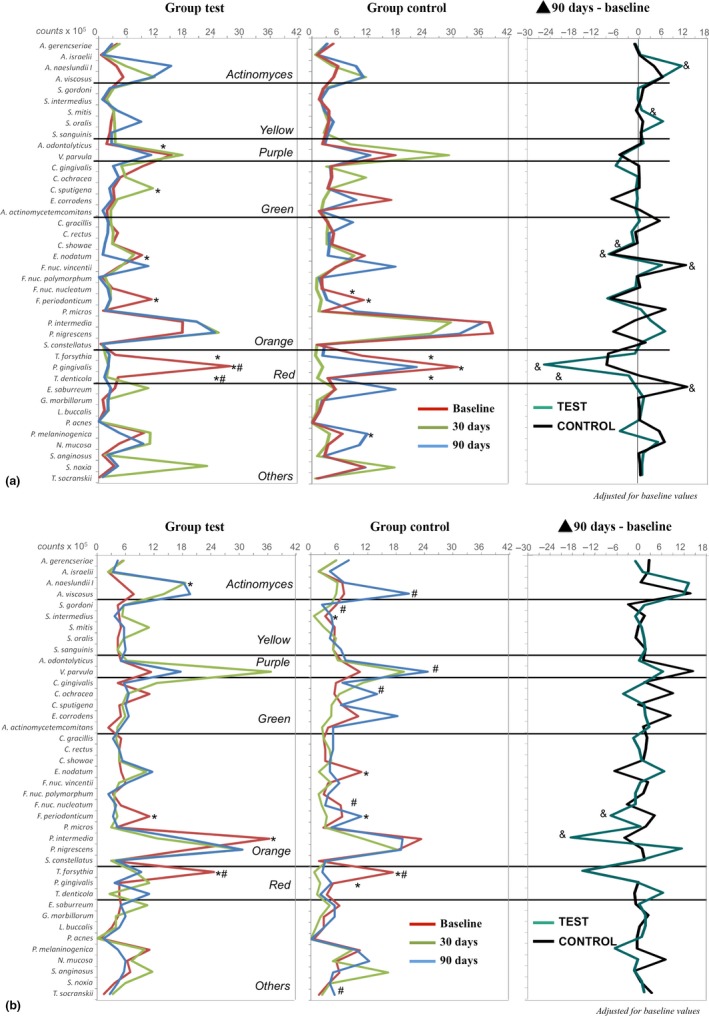
Figure 2.

Profiles of the mean counts (×105) of 40 taxa in subgingival biofilm samples at baseline and at 30 and 90 days post‐treatment. The panel at the far right presents the changes in the mean counts of each species between baseline and 90 days post‐treatment. The species were ordered according to the microbial complexes described by Socransky et al. (1998). The significance of differences among time points was determined using Friedman test (*p < 0.05 at 30 days and # p < 0.05 at 90 days) and between groups at 90 days using Mann–Whitney test (& p < 0.05). All the analyses were adjusted for multiple comparisons (Socransky et al., 1991). (a) deep pockets, (b) moderate pocktes
