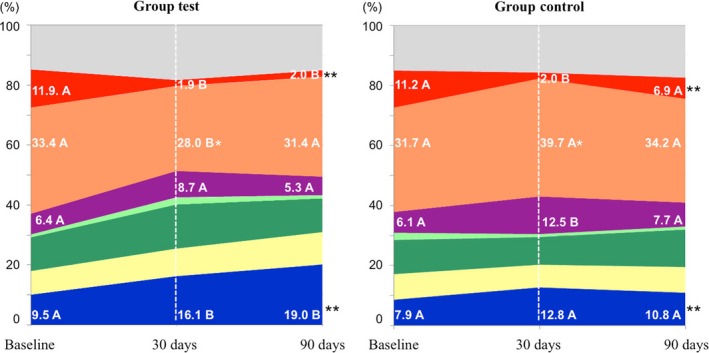
Figure 3.

Cumulative mean proportions of microbial complexes in subgingival biofilm samples taken from subjects at baseline and at 30 and 90 days post‐treatment. The colours represent different microbial complexes (Socransky et al., 1998). The light green colour represents the proportion of Aa. The grey colour represents species that did not fall into any complex, and Actinomyces species are represented in blue. The significance of differences among time points was determined using Friedman and Dunn multiple‐comparison tests (different letters represent significant differences between time points, p < 0.05). The significance of differences between the two groups at 30 days and 90 days was determined by using Mann–Whitney test (*p < 0.05 at 30 days and ** p < 0.05 at 90 days)
