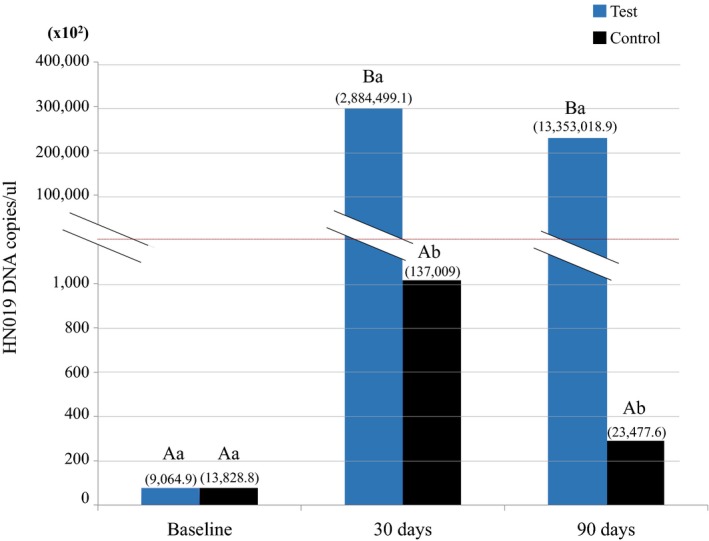
Figure 4.

Number of copies/μL of Bifidobacterium animalis subsp. lactis HN019 DNA and standard deviations (numbers above the columns) in samples of subgingival biofilm of Test and Control groups at baseline, 30 days, and 90 days, as well as intra‐ and inter‐group comparisons. Different majuscule letters indicate significant differences in each group over experimental time (Friedman test, Dunn, p < 0.05). Different minuscule letters indicate inter group differences within the same time point (Mann–Whitney test, p < 0.05)
