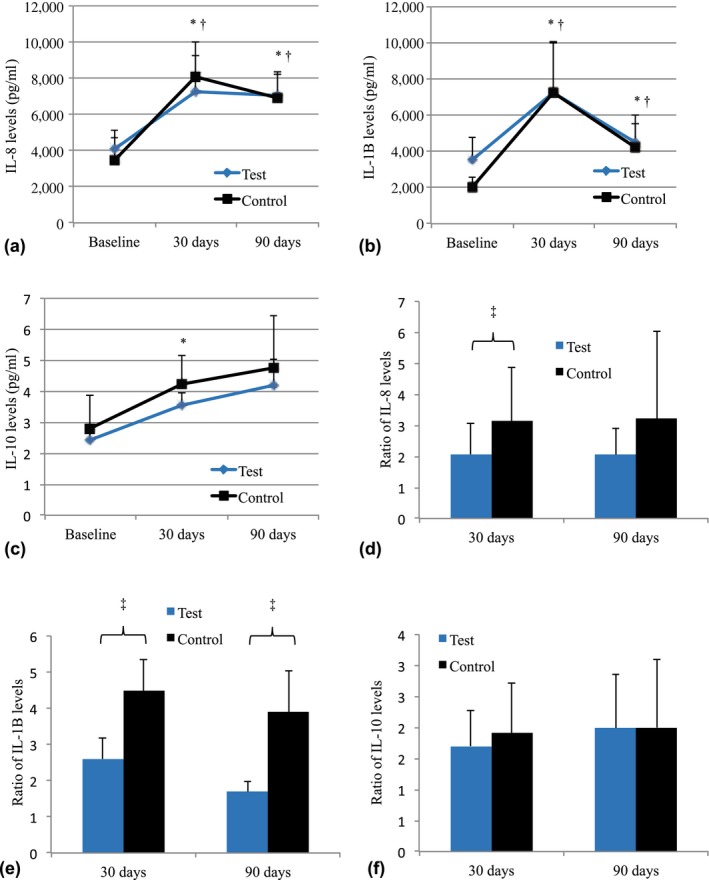
Figure 5.

Levels (pg/mL) of IL‐8 (a), IL‐1β (b), and IL‐10 (c) for each subject of groups Test and Control at baseline and at 30 and 90 days post‐treatment. The mean changes in cytokines levels in relation to baseline values for Control and Test groups can be observed in d–f. *Significant difference in Test group when compared with baseline values (Repeated Measures ANOVA, Bonferroni, p < 0.05). †Significant difference in Control group when compared with baseline values (Repeated Measures ANOVA, Bonferroni, p < 0.05). ‡Significant difference among groups in the same time point (Student t test, p < 0.05)
