Figure 2.

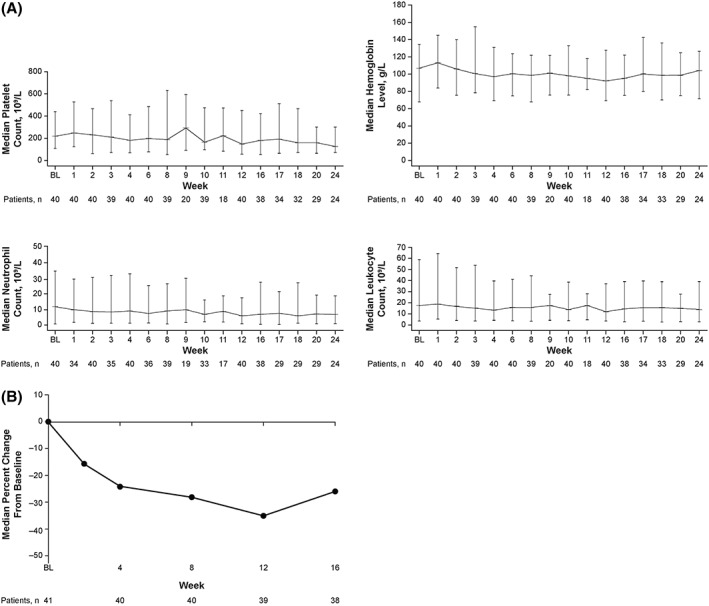
Phase 2 study of patients with myelofibrosis: blood counts over time (A)a and median percentage change in spleen length from baseline to week 16 (B). BL, baseline. aData are median ± range

Phase 2 study of patients with myelofibrosis: blood counts over time (A)a and median percentage change in spleen length from baseline to week 16 (B). BL, baseline. aData are median ± range